An alphabet soup of economic recovery shapes exists to explain past, present and future changes in economic activity, which is often measured using gross domestic product (GDP). These shapes help to illustrate the magnitude and pace of the economic downturn, as well as the magnitude and pace of the recovery that follows. It is important to learn about the theoretical concepts. It is equally important to see how these concepts materialize in real life.

For illustration purposes, all GDP levels have been normalized to the current US$ dollar to remove the effects of inflation of the local currency. This does however reflect the impact of currency fluctuations between the target country and the United States.
The Types of Economic Recovery Shapes
V-shaped: The Great Recession in the US is a good example of a V-shaped economic recovery if you look at the annual GDP. As seen in the chart below, the annual GDP in the US declined sharply from 2008 to 2009 following the collapse of Lehman Brothers. The GDP subsequently rebounded in 2010 back to its previous level.
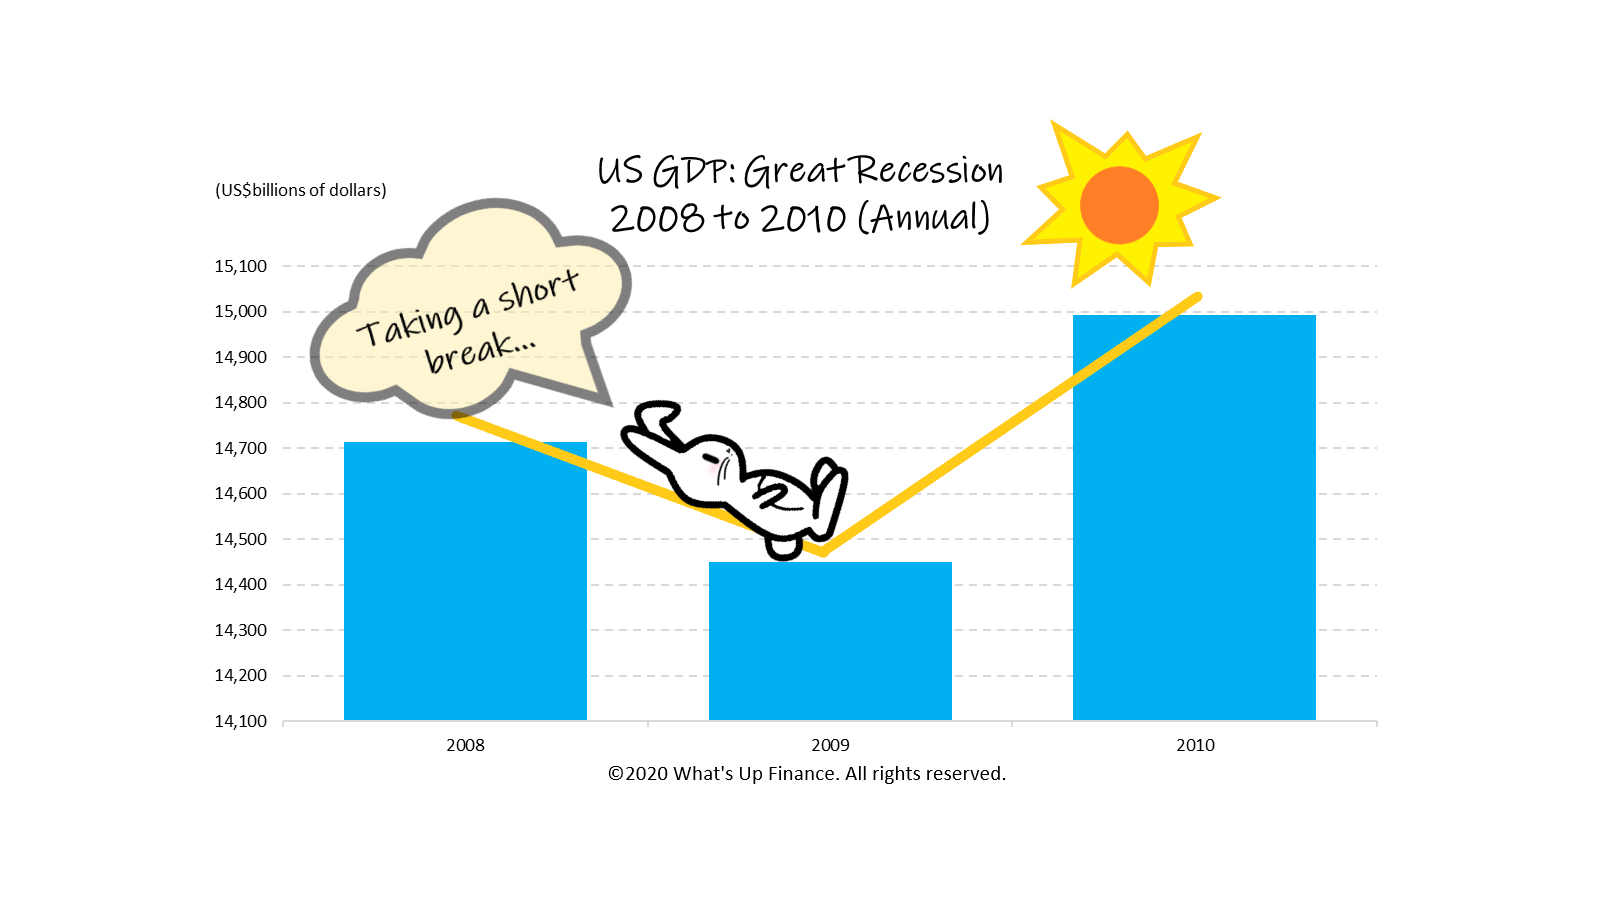
An interesting observation is that if you look at the quarterly GDP data instead, you will see the decline in economic activity was more gradual, so was the subsequent recovery. The quarterly GDP data would suggest more of a U-shaped recovery than a V-shaped one. Both are technically correct. It just depends on the frequency of data you look at.
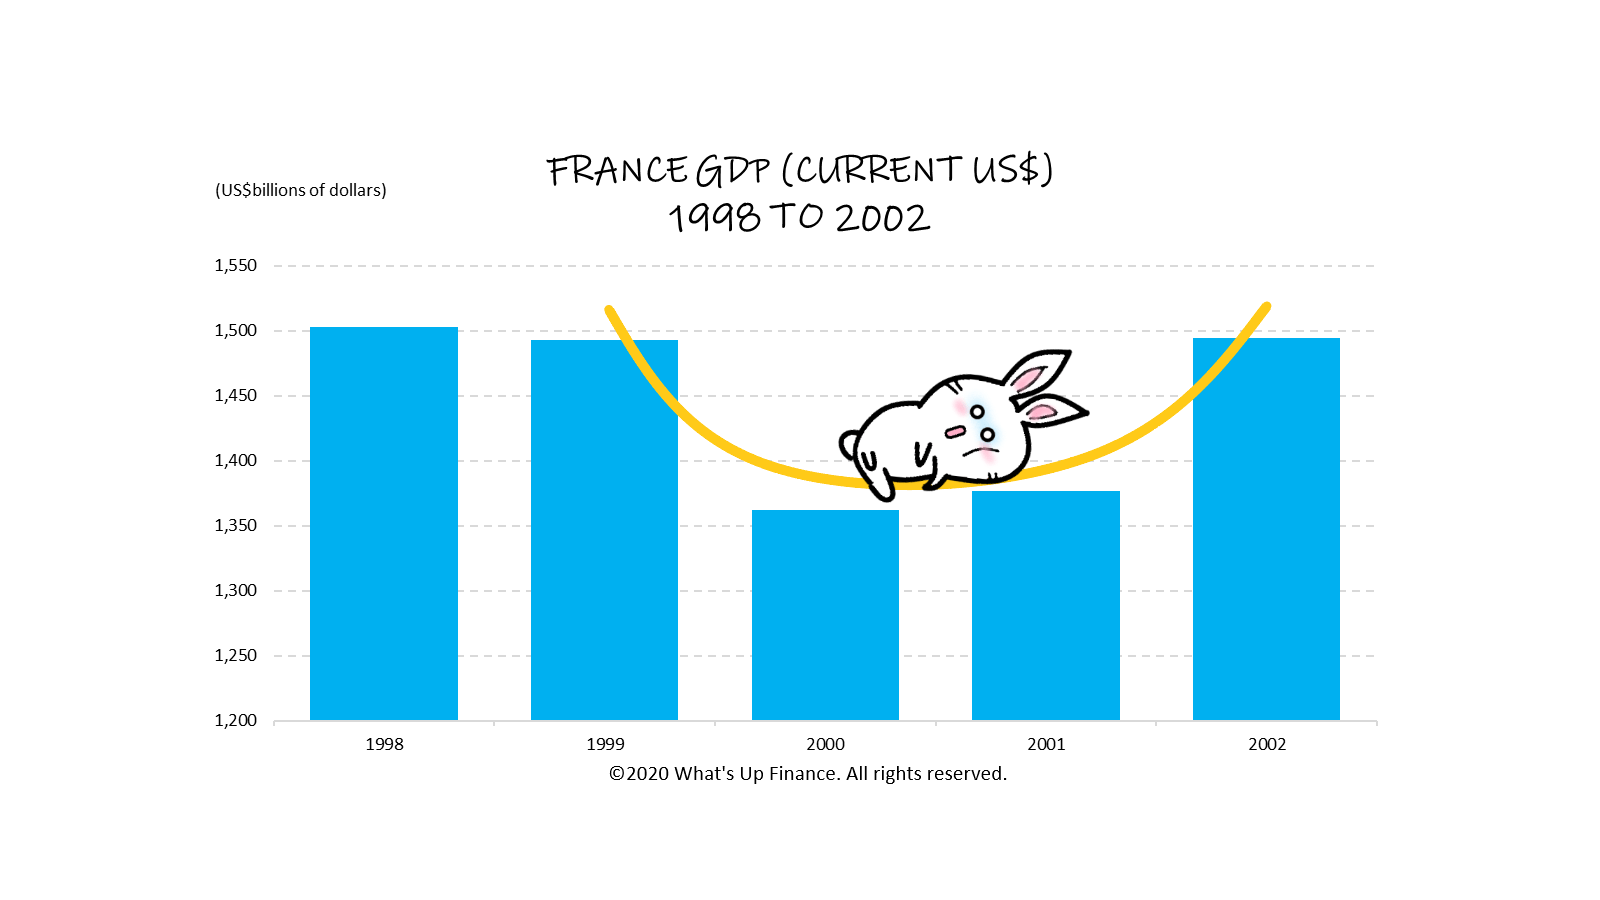
U-shaped: Like much of western Europe, France’s economic activity took a dive in 2000. The country’s GDP dropped from $1.5 trillion dollars to $1.36 trillion dollars. The economic activity remained relatively unchanged in 2001 at $1.38 trillion dollars. However, by 2002, the economic activity picked up and reached its previous level at $1.5 trillion dollars.
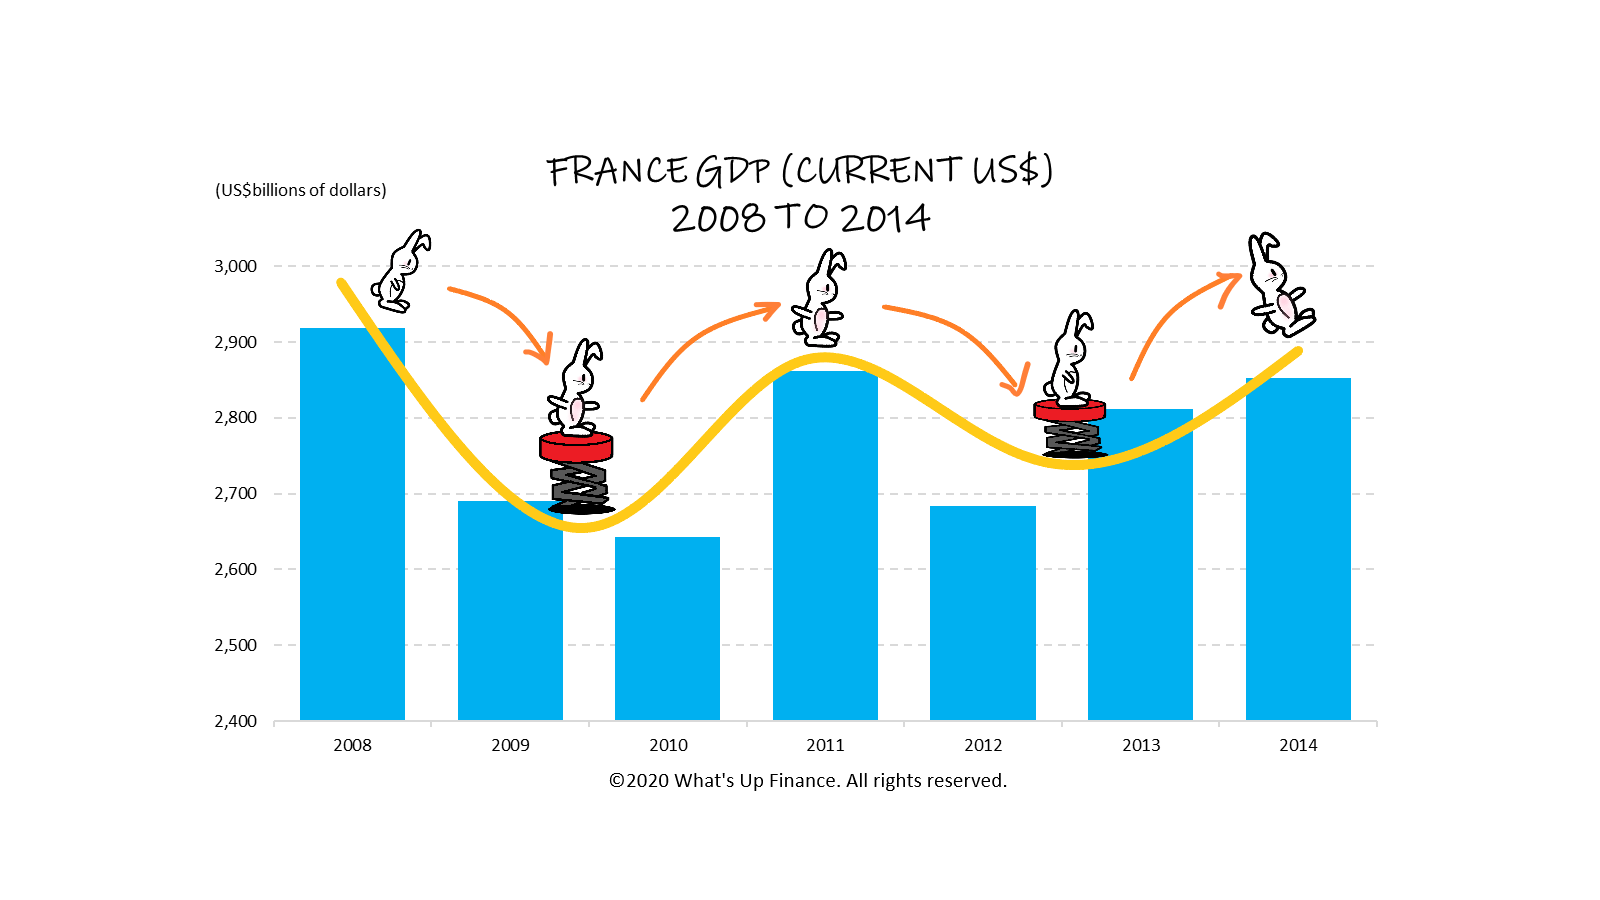
W-shaped: A W-shaped economic recovery is characterized by a sharp decline, followed by a rebound and a second dip in economic activity. France’s historical economic activity turned out to be quite good examples of various economic recovery shapes. Fast forwarding six years after its previous recession to 2008 (known as the year that kickstarted the Global Financial Crisis or GFC), economic activity declined sharply from $2.9 trillion dollars to $2.7 trillion dollars in 2009, and to $2.6 trillion dollars in 2010. Its economic activity rebounded in 2011 but the GDP declined again in 2012 after experiencing another shock. Fortunately, France’s national output began to pick up pace in 2013 and onwards.
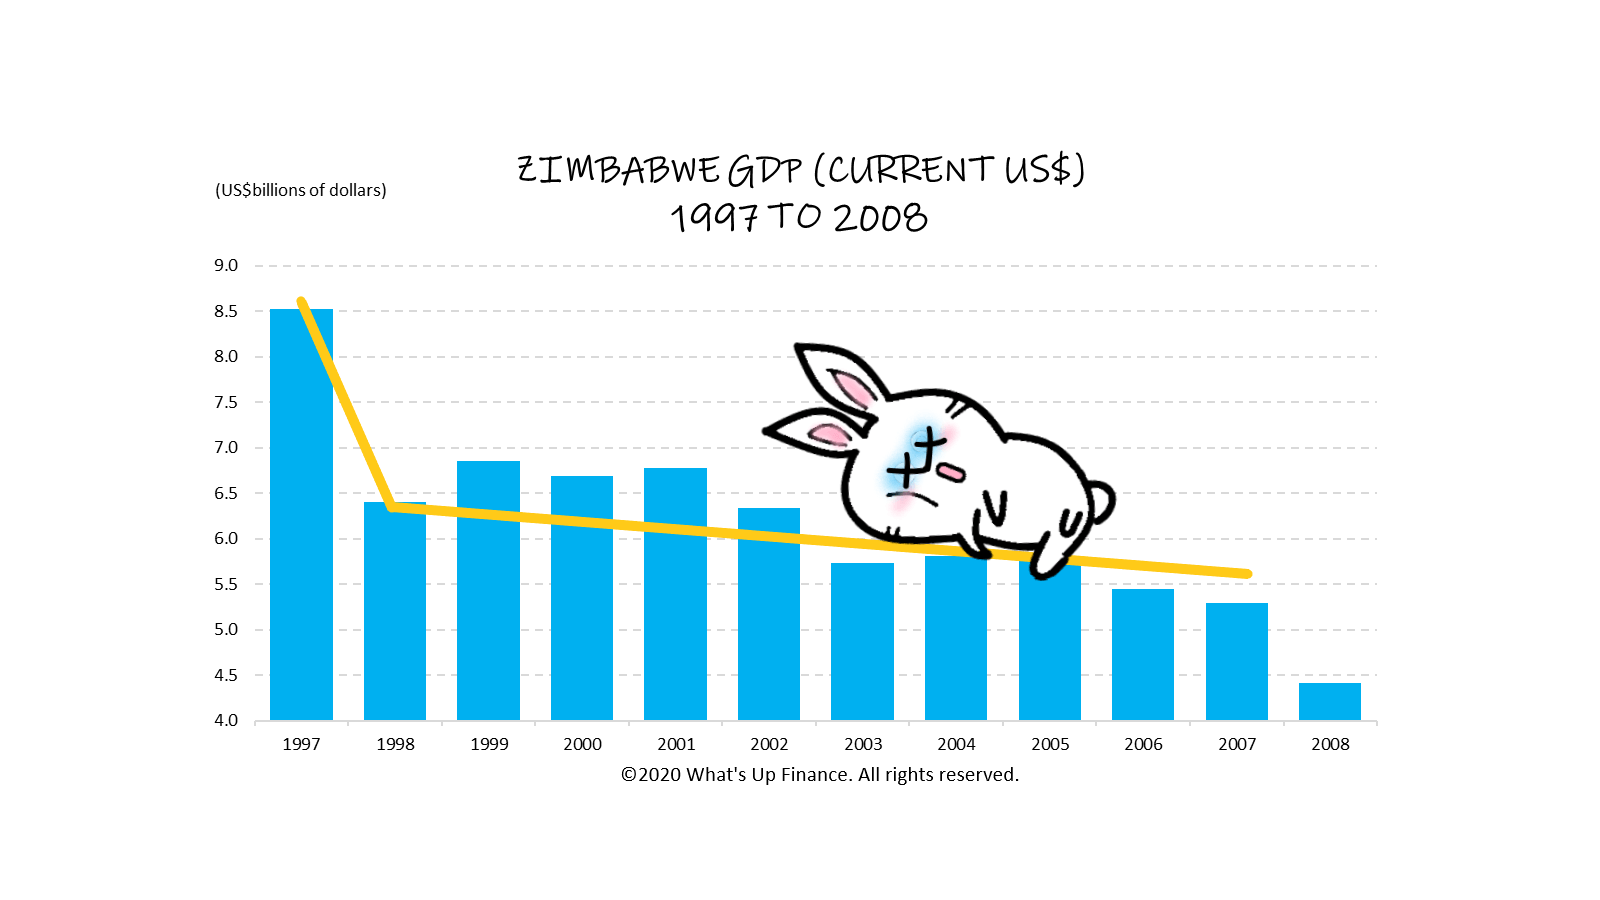
L-shaped: A L-shaped consists of a precipitous decline followed by stagnant economic activity over the course of several years. Zimbabwe experienced such a decline in 1997 due to a myriad of issues, which included deterioration of the general health of the population and political instability leading to a wide range of international sanctions. Its economic activity remained depressed for the next decade.
Swoosh-shaped: Many economists and bankers hold the belief that many nations including US and China will follow a swoosh-shaped recovery shape. Nationwide lockdowns caused a sudden decline in economic activity. As businesses ease back into operations, the expectation is that the recovery will be gradual and steady.
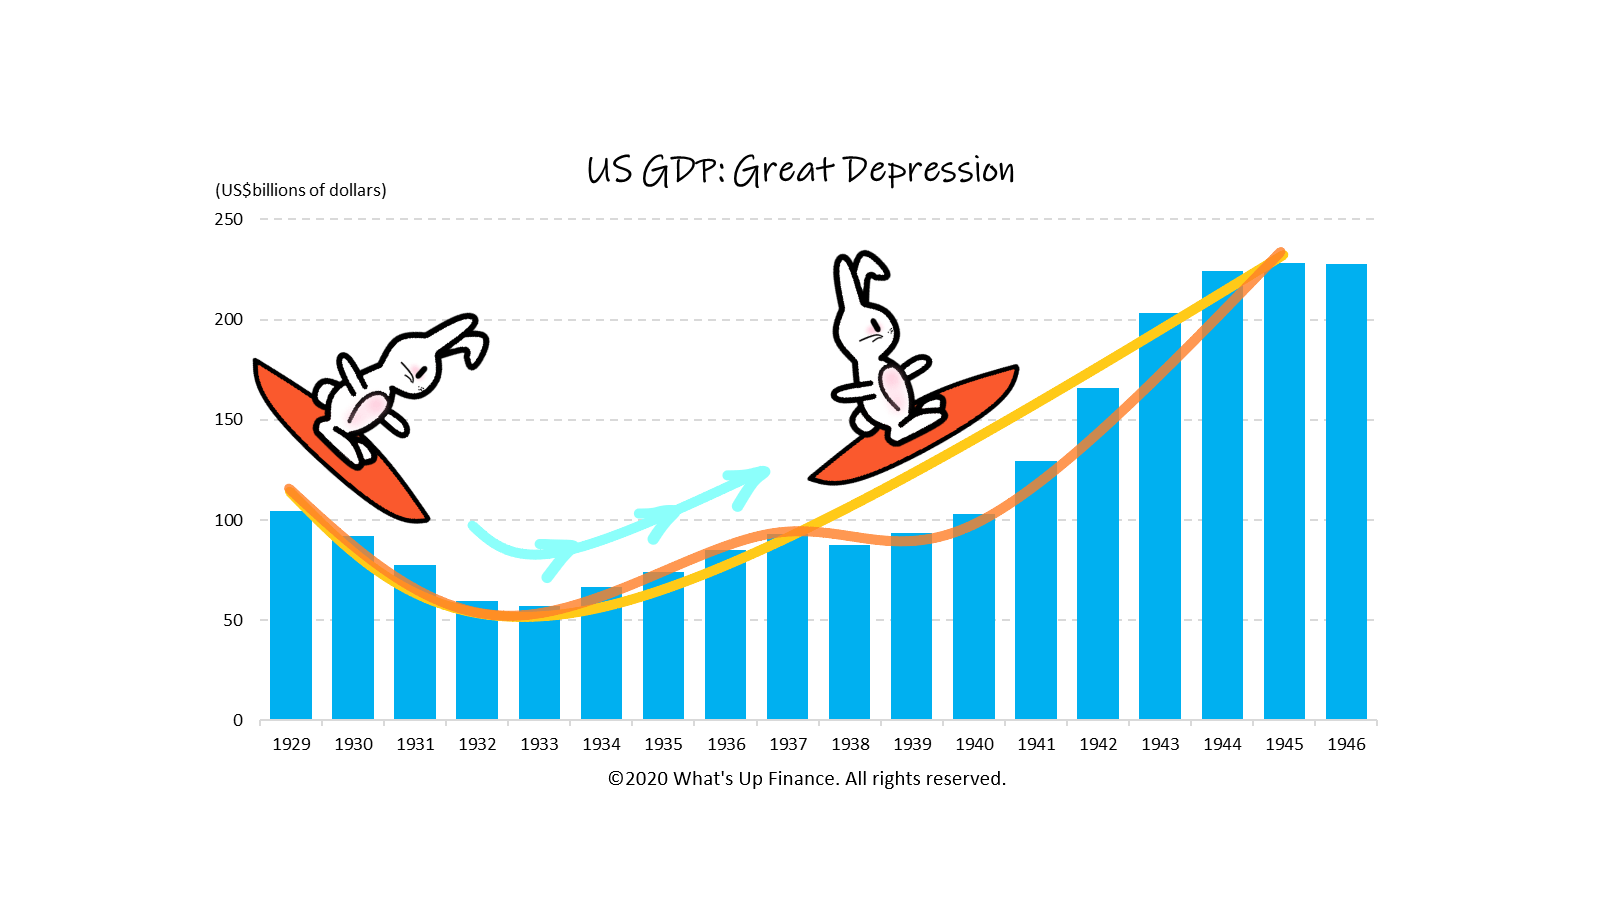
The Great Depression
Let’s take a look at the infamous Great Depression that plagued most of the world in the 1930s. In the US, economic activity declined year after year from 1929 to 1933. The economy began to recover until the combination of tightening fiscal and monetary policy, and the decline in business investments resulted in another economic setback in 1938. Economic activity gained strong traction when World War II began in 1939. If you look closely, you can see that the Great Depression and the subsequent recovery generally followed the swoosh-shaped. However, the setback in 1939 also suggested a W-shaped recovery.