Supply and Demand. This is where it all begins. The nucleus, the first building block, the root of it all… You get the idea. As such, discussing the fundamental concept of demand and supply is very fitting for What’s Up Finance’s inaugural post.
The law of supply and demand is a theory that explains the interaction between (i) the availability of a product or resource, and (ii) the desire for that product or resource, at a given price. Now let’s take a look at the two components.
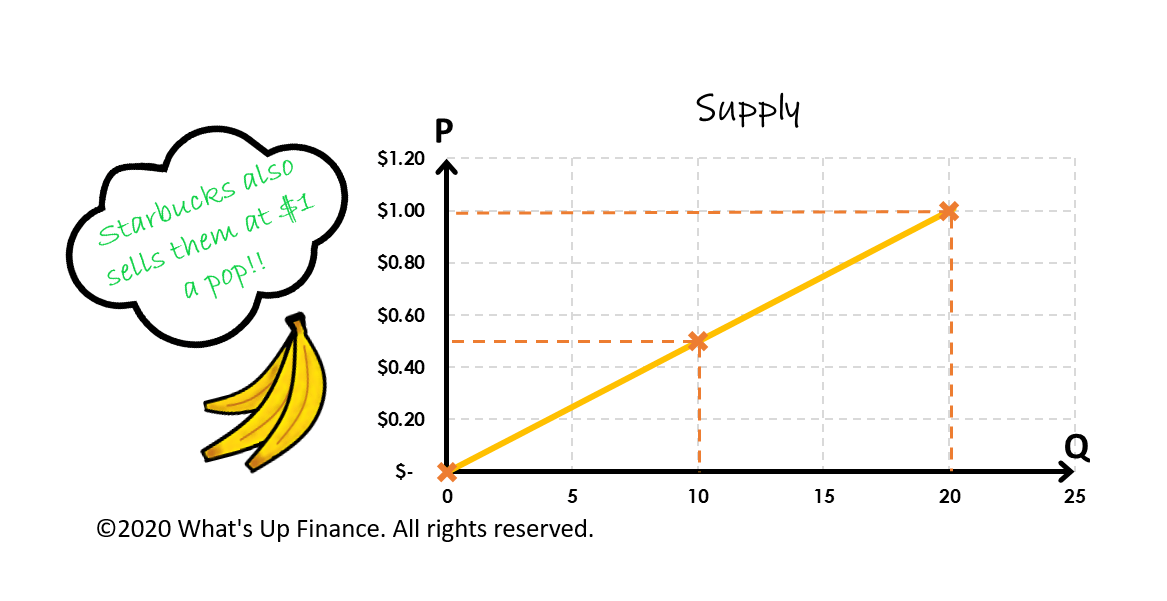
Supply is the availability of a product at a given price. The availability is determined by how many products the sellers want to sell at that price. How does this work? Let’s take the example of banana sellers. To make this even simpler to understand, let’s assume there is no cost associated with growing, obtaining or selling the bananas for the sellers. At $0, no one will be really incentivized to sell the bananas (or put it more accurately to give away the bananas.) At $0.50, the sellers are willing to sell 10 bananas since they are making some money from it. At $1, selling bananas seems like a great business (it is basically the same price Starbucks sells their bananas for)! Sellers are loving this and are willing to sell a whopping 20 bananas! (This is not a very big banana market, maybe suitable for a single Animal Crossing island.) These three datapoints are then used to map out the supply curve. From this example, we can see that the higher the price, the higher the quantity supplied by the sellers, which means the greater the availability of the product.
This seems great and all. But don’t forget about the demand side of the banana market.
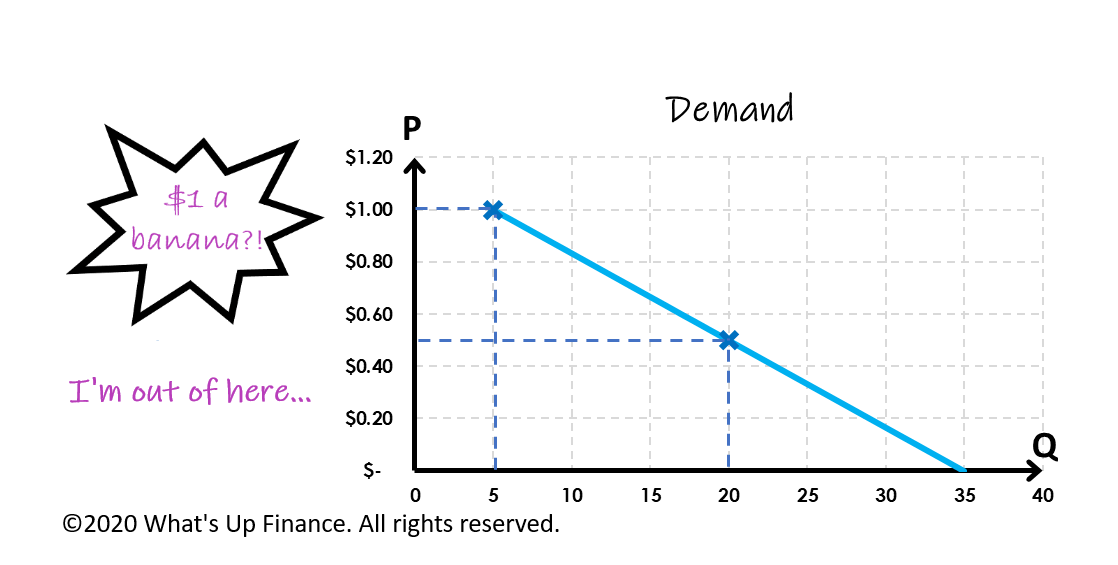
Demand is the desire of a product at a given price point. Said another way, how many people are willing and able to buy the product at that price. Let’s go back to our banana example. At $0 (or free bananas), there will be lots of buyers. When the bananas are $0.50, the desire for bananas shrinks so the quantity demanded is lower. At $1 a banana, even fewer people will be enticed to buy the bananas. These points comprise the demand curve. As you can see, the higher the price of a product, the lower the quantity demanded for the product. This is opposite to the relationship between price and quantity supplied.
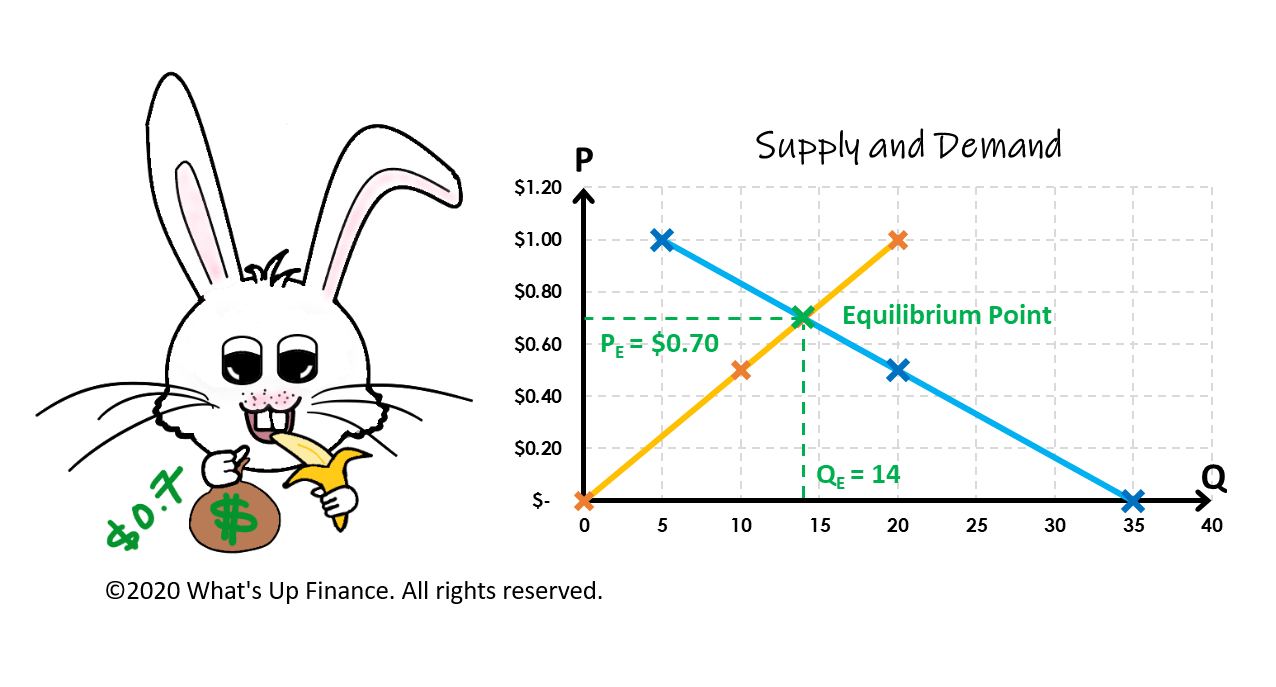
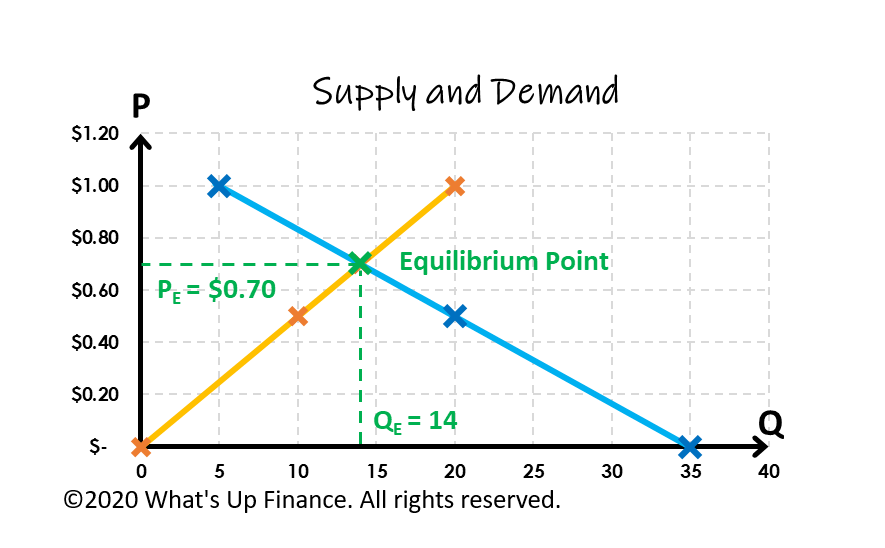
Now let’s look at supply and demand together. Once you’ve determined the quantity supplied and the quantity demanded at any given price point, you can plot both curves together. As you can see, the point at which both curves intersect is the equilibrium for the product. Because we have a two-dimensional graph, that means there is a price (y-axis) and quantity (x-axis) associated at the equilibrium point. In this arbitrary example, the equilibrium price is $0.70 a banana and the equilibrium quantity are 14 bananas!
The above example depicts a very simple economy and exists in a vacuum; however, it serves well to illustrate the supply and demand for a product that is a basic want. This is supply and demand in a nutshell.